When trying to debug things in the browser, it’s common to pop open your browser’s dev tools or reach for an OS level proxy such as Proxyman.
One alternative for Chromium browsers that surfaces useful information is chrome://net-export. That URL should resolve both in Google Chrome as well as Chromium-based browsers such as Brave, Edge and so on.
You’ll be presented with a pretty plain looking page.
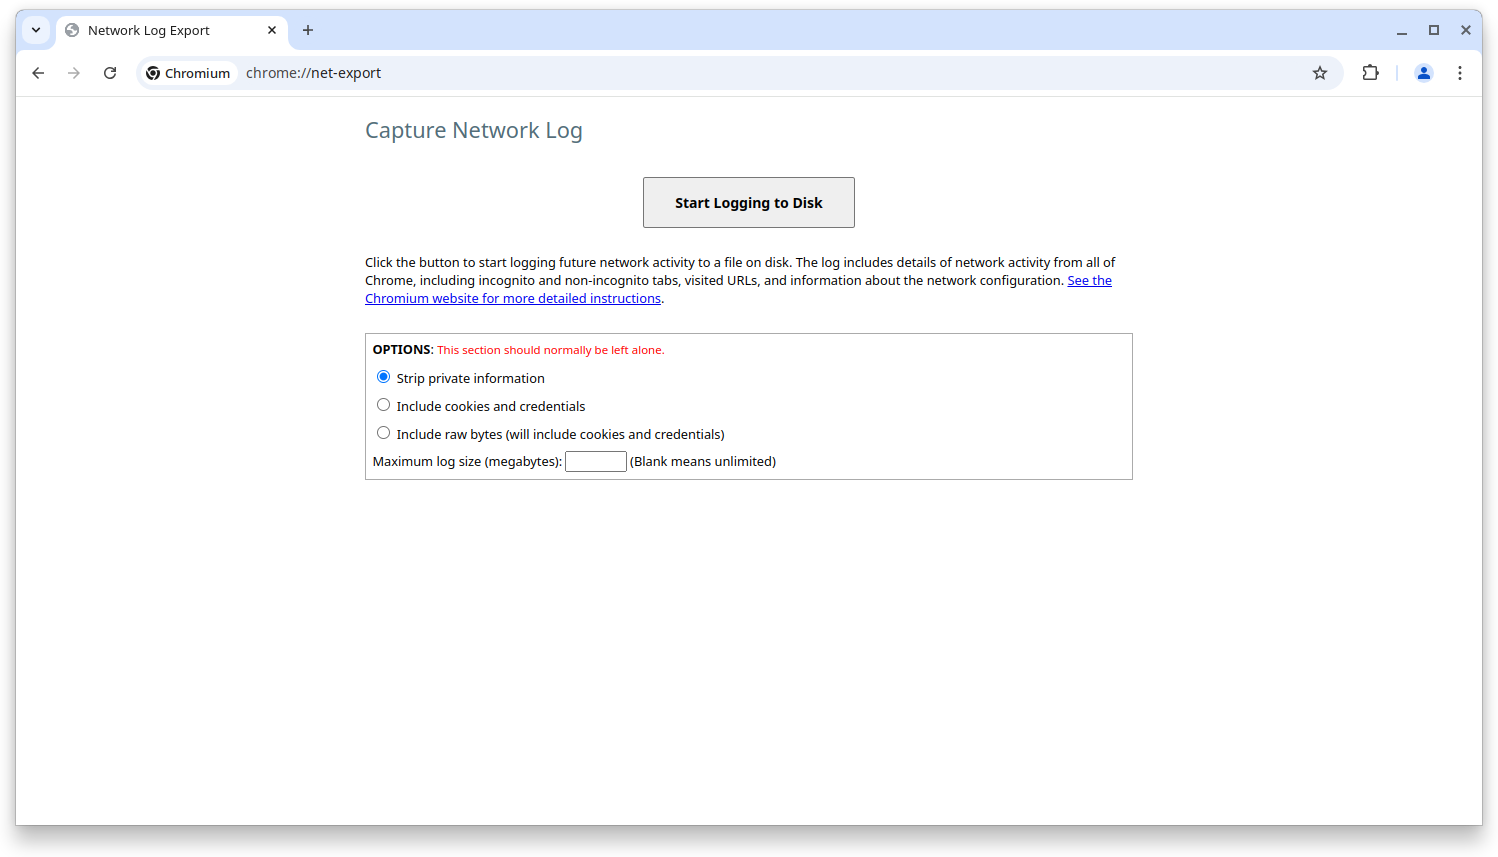

You can basically pick whether you want to strip private info and what the maximum log size should be.
Clicking “Start Logging to Disk” will start spooling data to a JSON file until you stop doing so.
So, once you’ve got a NetLog dump, now what?
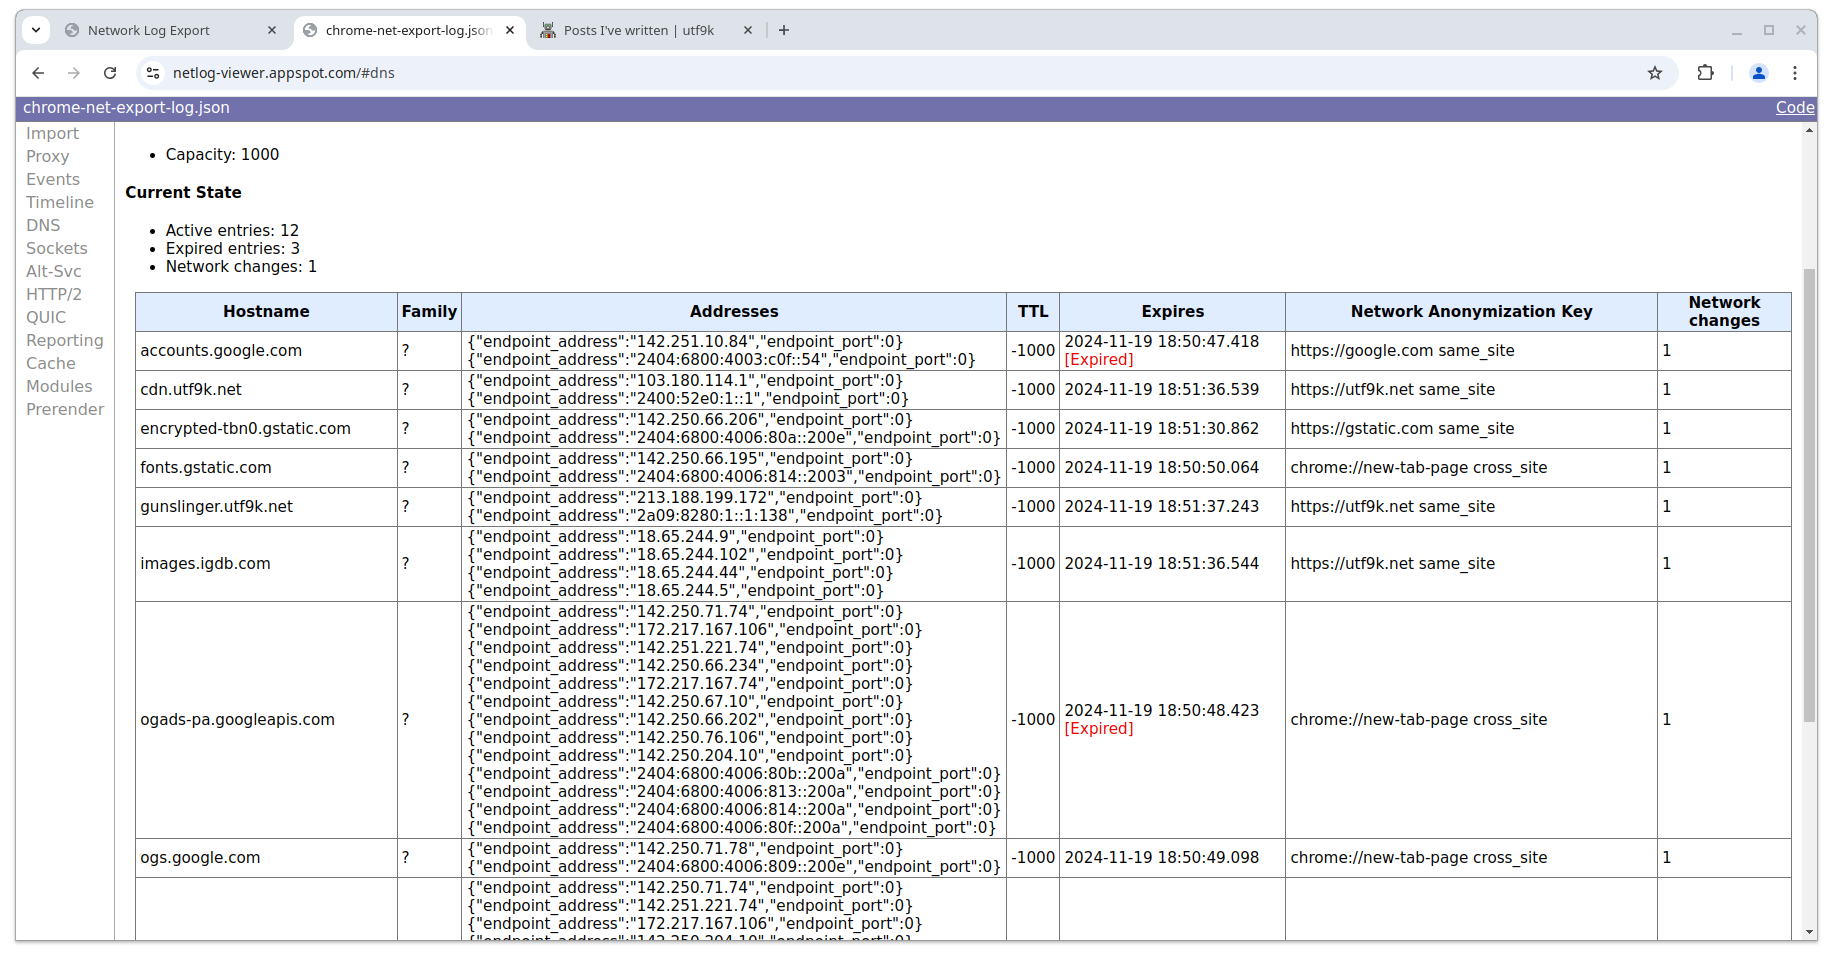
You can use the browser-based Netlog Viewer which will render the contents within your browser rather than sending them off to a third party.
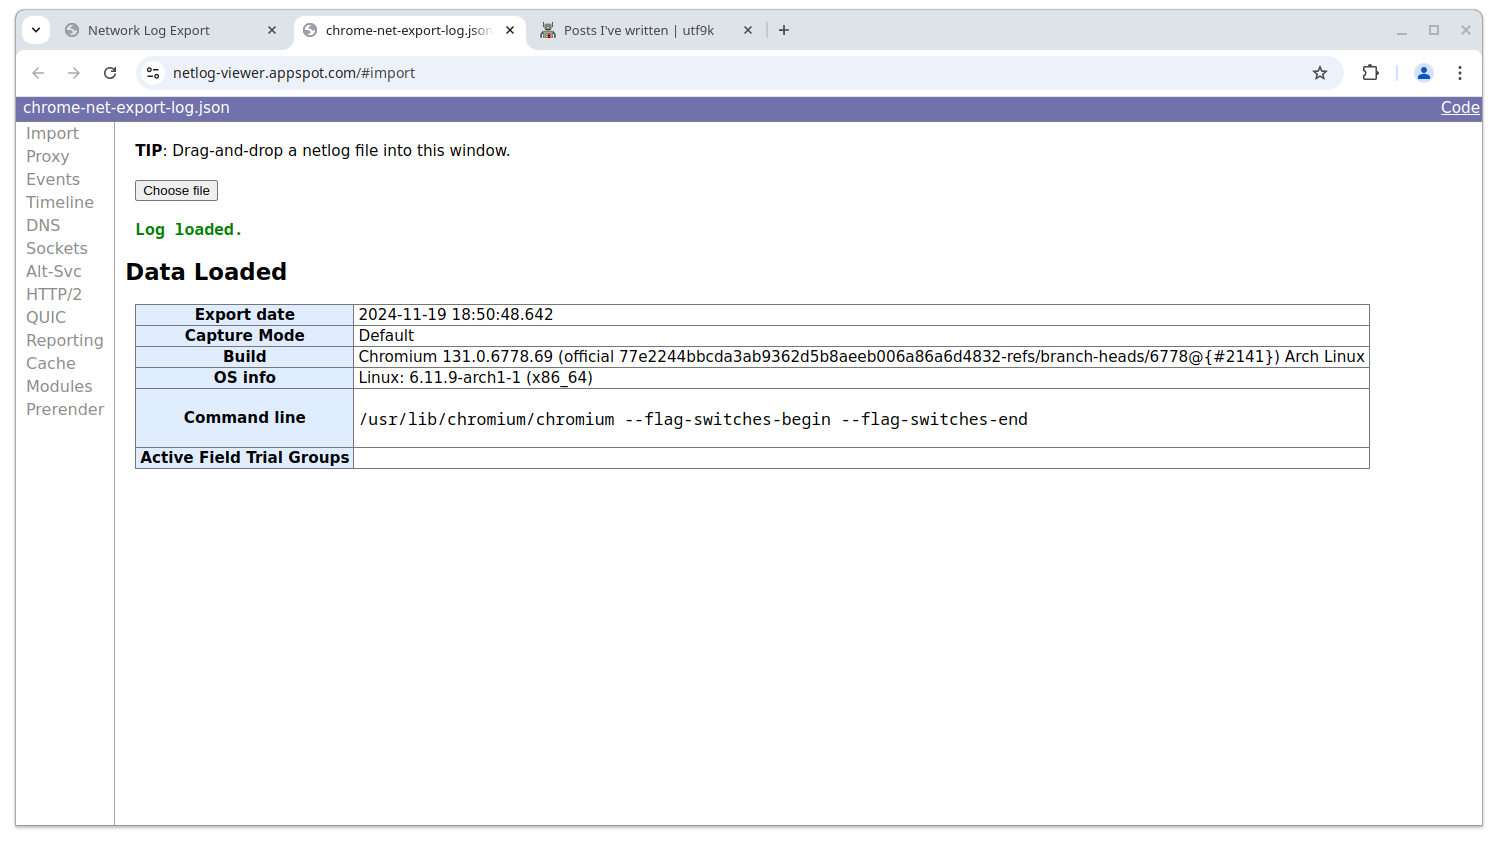

This can be useful if you want to share your net dump with a coworker who may be helping to debug a technical issue for example.
There’s a lot of useful insights in here such as a full timeline of traffic, including disc cachingwhich wouldn’t be captured by a standard man in the middle proxy.
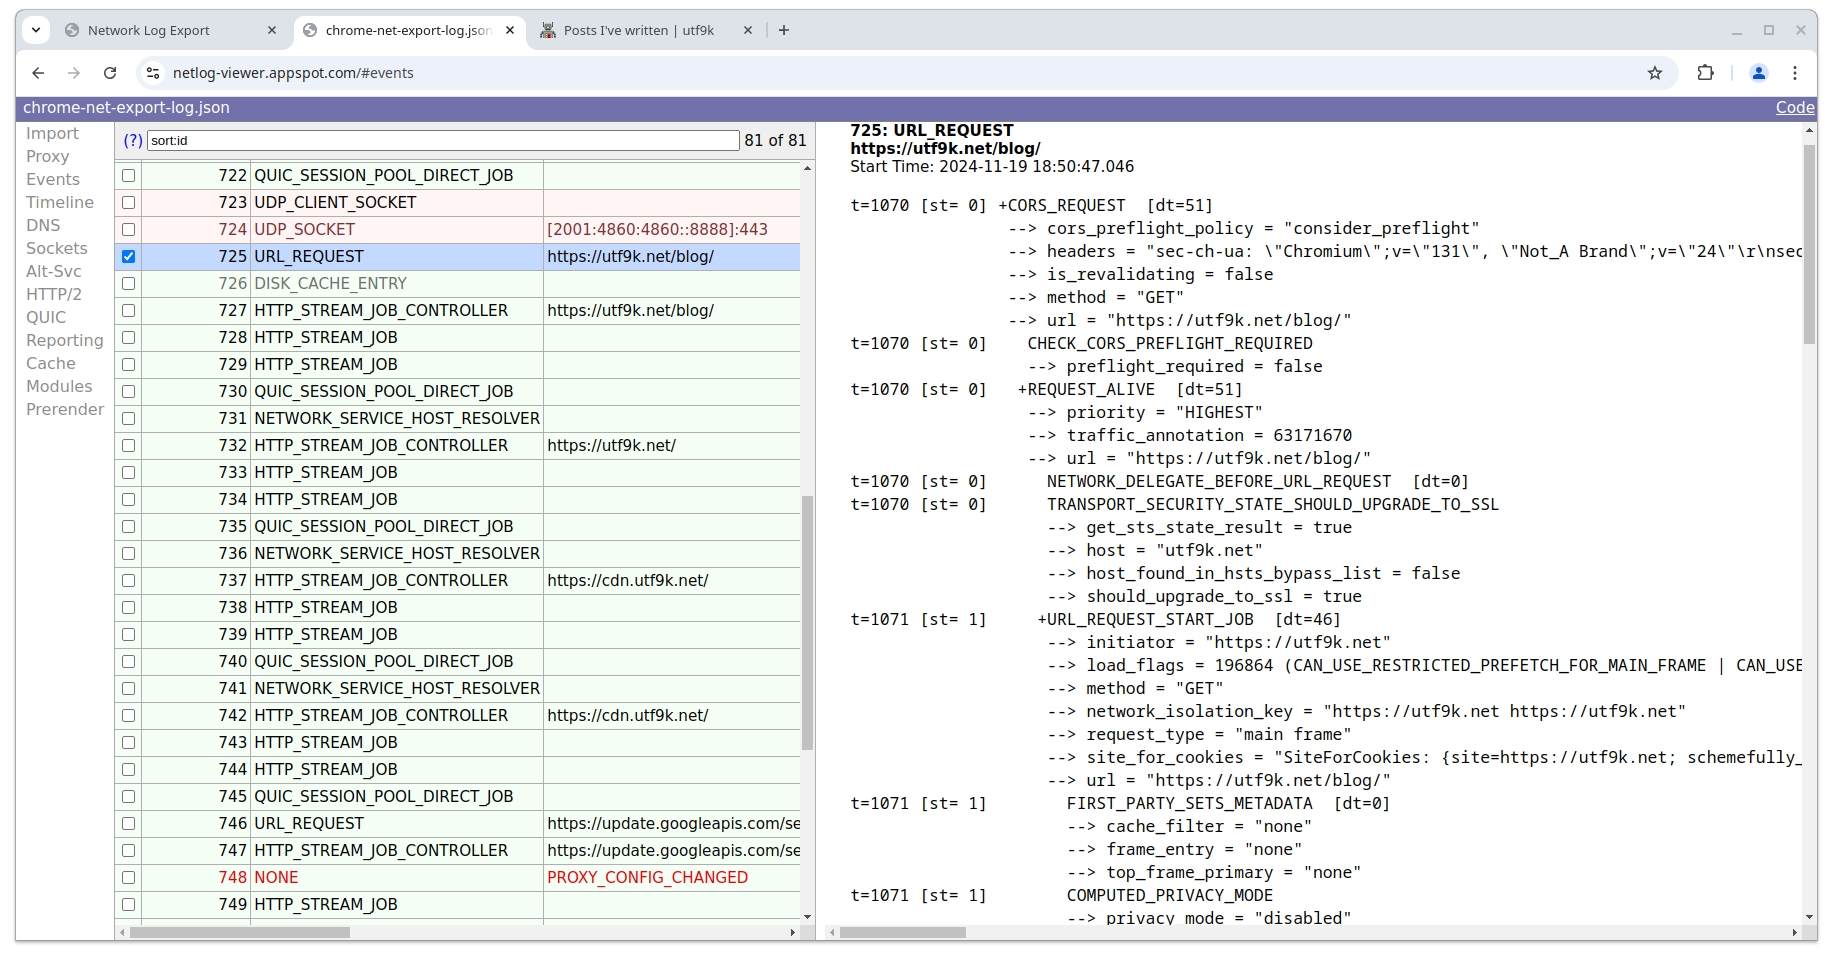

There are also a lot of other standard things like DNS lookups which can be valuable for debugging.

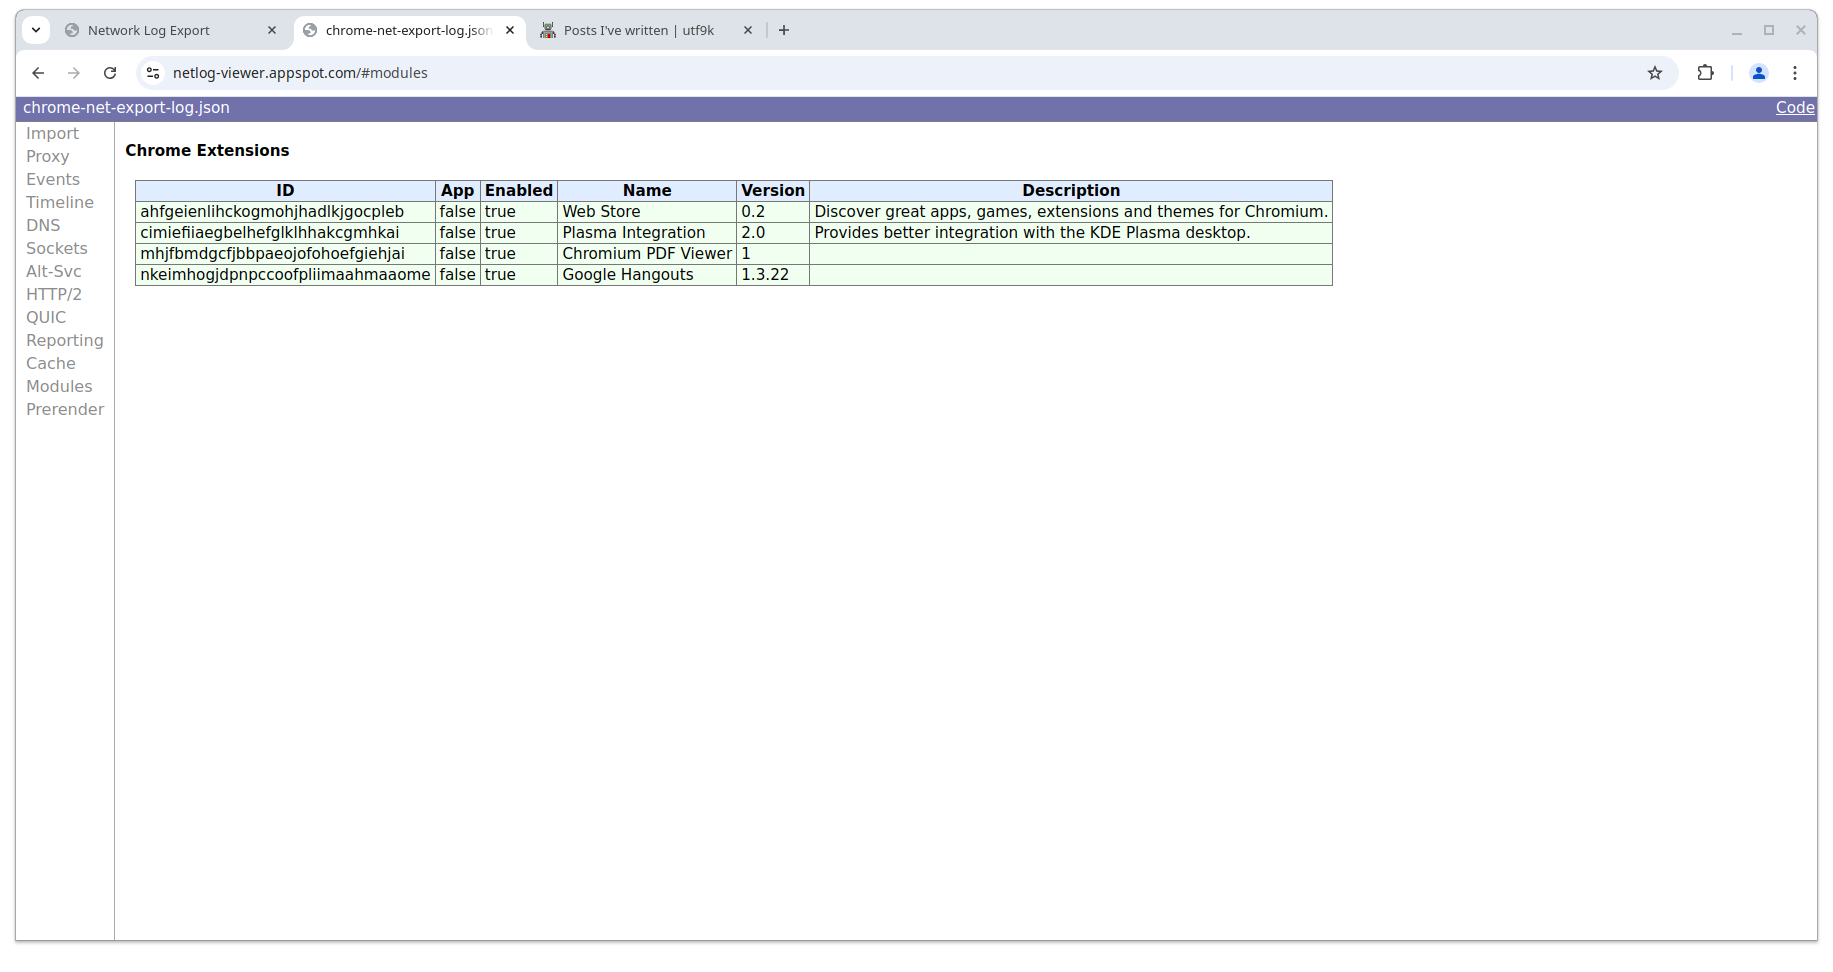
You can even see what extensions were loaded at the time, which may help to figure out if any of them may have been modifying traffic in a way that causes problems.
