
Quite a few years ago, I found myself sitting outside of a cafe. I was staring across the street at a carpark and noticed that every so often, a tow truck would pull in, towing a car behind it..
This is perfectly normal of course but after a few of these, it occurred to me that it might be interesting to see what that looks like from a birds eye view. Surely it would look like some of kind of stream where the towing yard is a hot spot with tentacles sprawling out all over the city.
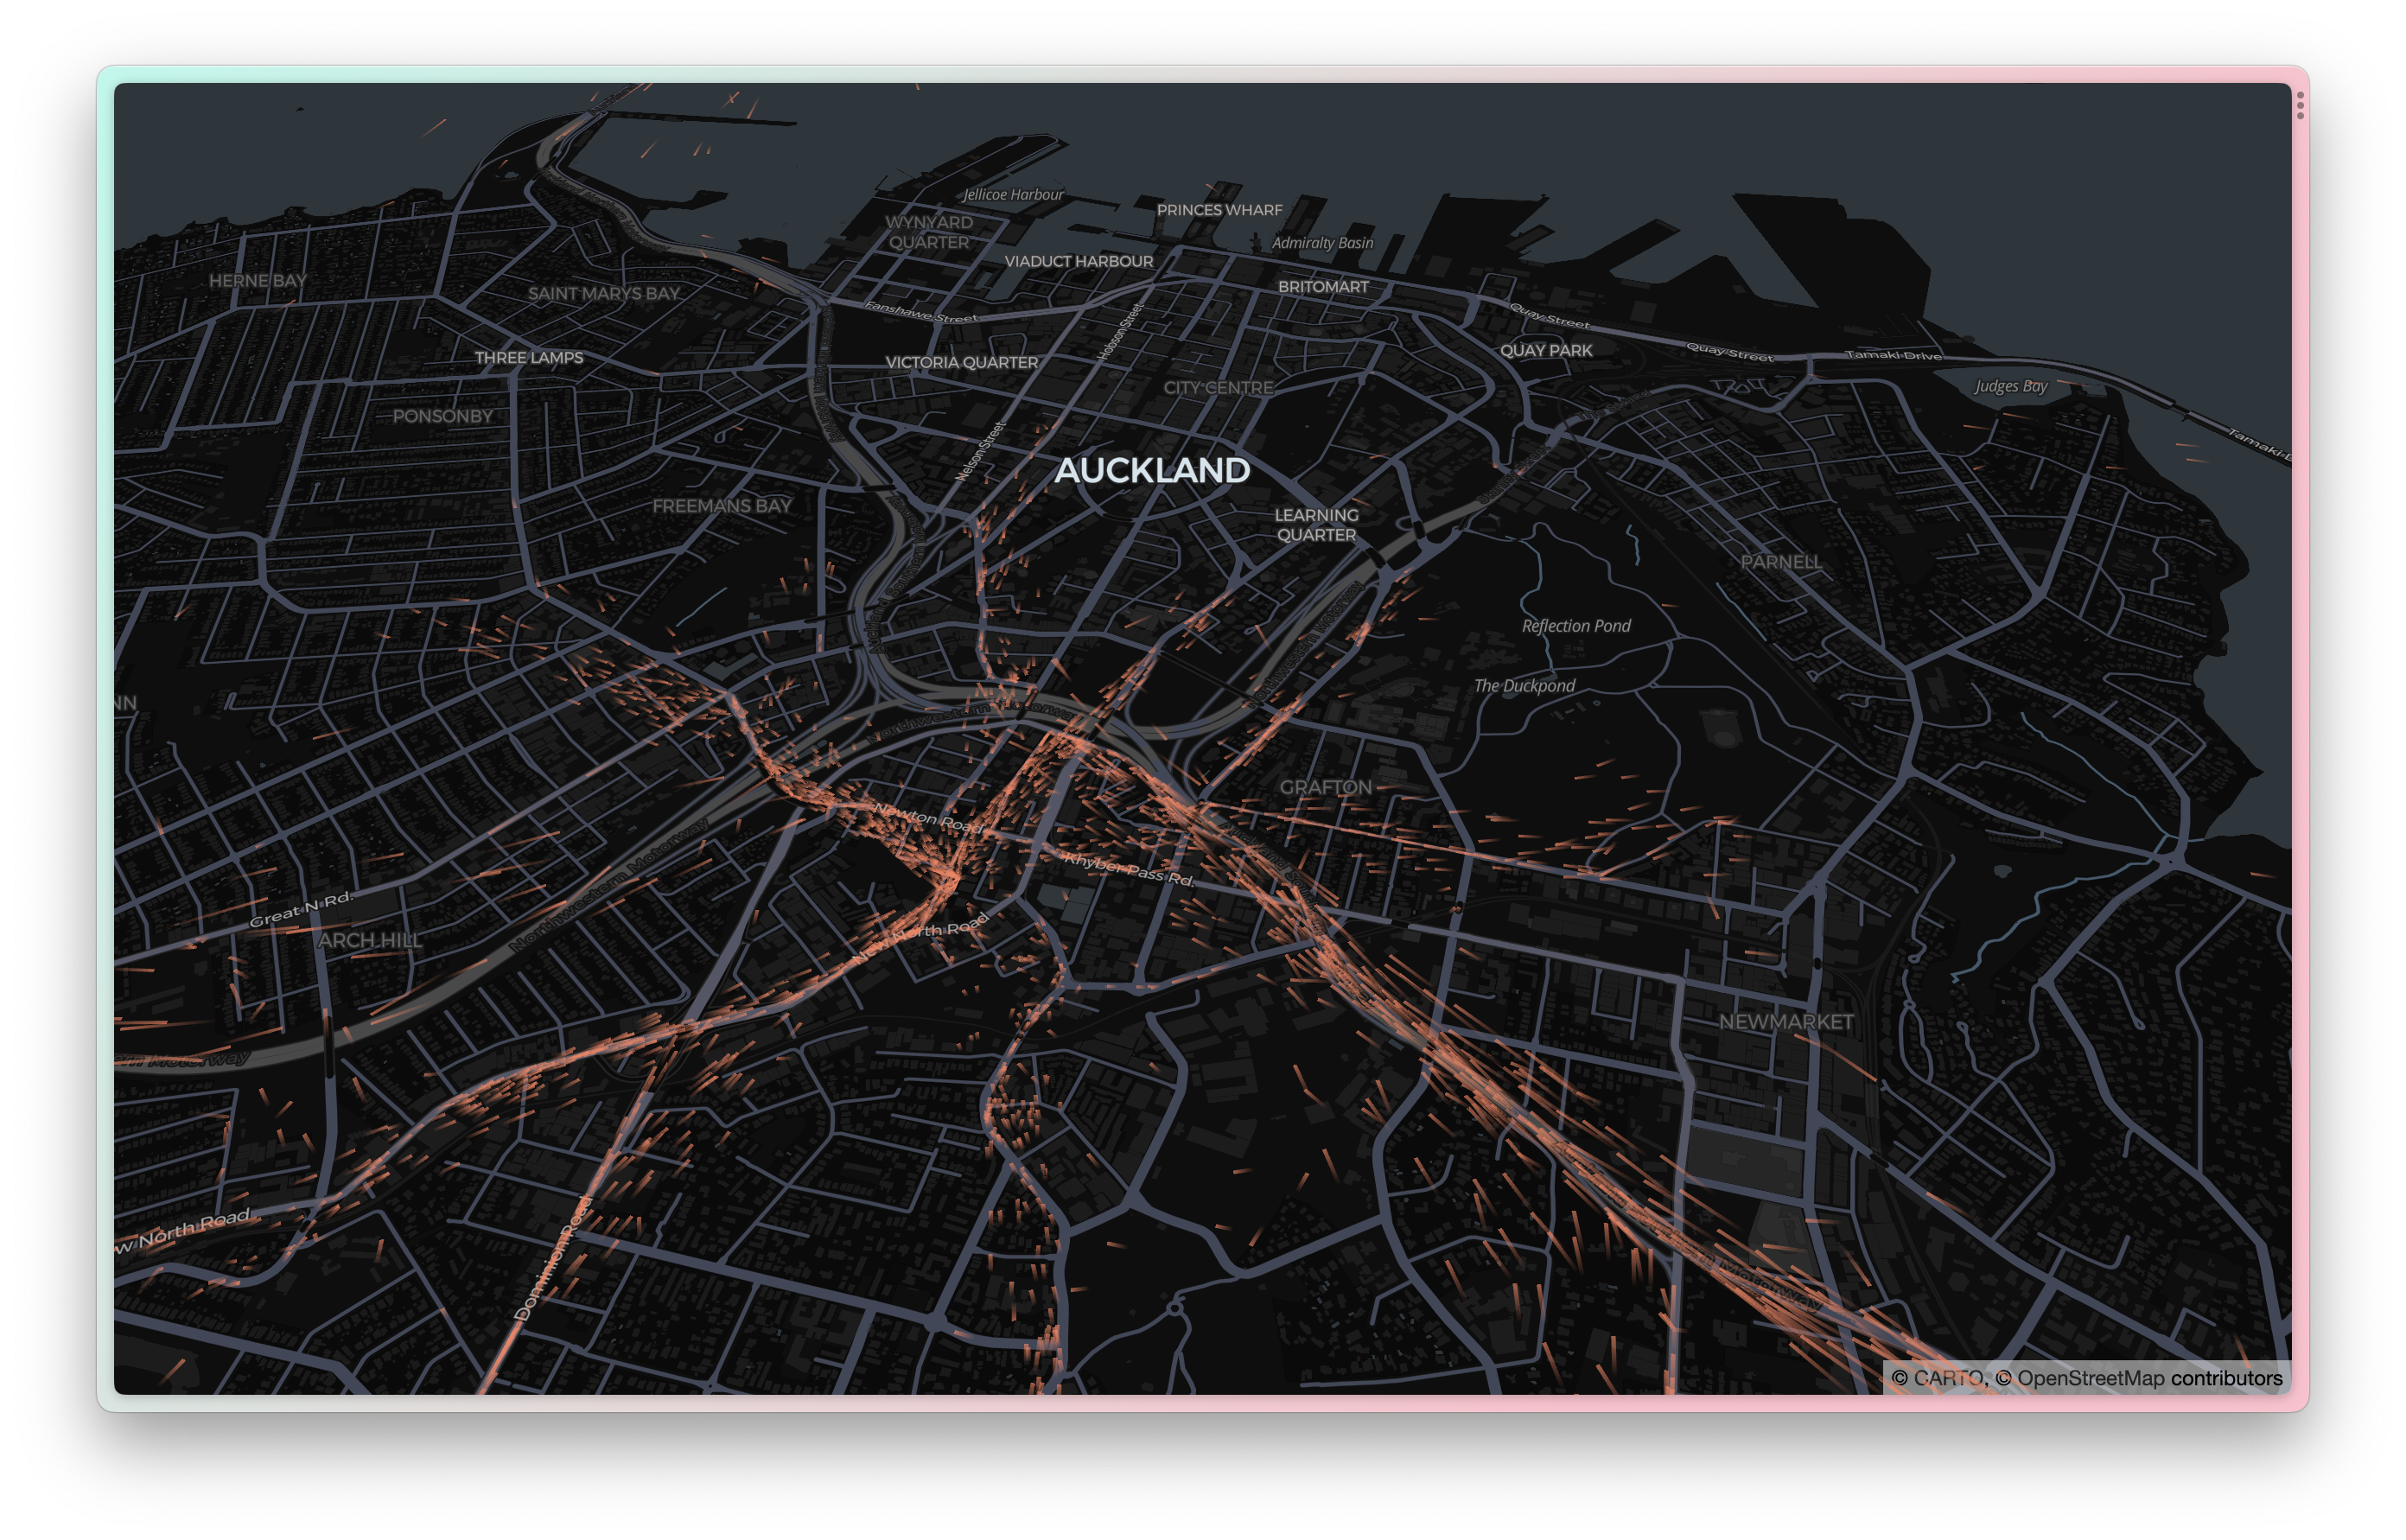
It took me quite a few years but I managed to go from this idea to a simulation that shows 3 years worth of vehicles, represented as orange lines, flowing throughout the city to their final destination.
You can’t just pluck out where a vehicle was picked up and taken to because that makes a straight line. To have the full effect, you need to figure out a likely route for every single instance and then plot a line across all of the streets in between for your simulated vehicle to follow.
I’m pretty proud of the final result which is probably one of the more advanced side projects I’ve put together, considering it started with a big messy spreadsheet and ended up with an interactive visualisation.
You can play around with the project just below but if you’d like to see a full screen version, or you have iframes disabled, then you can check it out here.
If you’d like to read a detailed write-up on how this was made, or follow along with creating your own version, you can find those details in this blog post.