
Recently, I was chatting with a coworker about the accuracy of tracing. In particular, we were discussing Datadog APM but the same discussion probably applies equally to OpenTelemetry as well as other SaaS provider implementations.
To be clear, when I say accuracy here, I don’t mean the accuracy of what each trace is presenting. The overall picture is more than accurate enough but I would argue that it will never 100% reflect reality, nor is that necessarily something valuable to obtain.
I thought it might be interesting, both for my own future reference but also just as a general discussion to go through some of the various ways that tracing may not reflect reality in its entirety.
The outer wall
First of all, there are surely some portion of requests that will never reach your servers in the first place.
There are probably not a lot in accurate but you might imagine various scenarios like someone attempting to visit your website only for their ISP’s DNS server to throw a fit, or someone browsing on a train only for their connection to get temporarily blackholed as they pass through a concrete tunnel.
These requests won’t even reach you so they won’t even show up in your tracing.
Application sampling
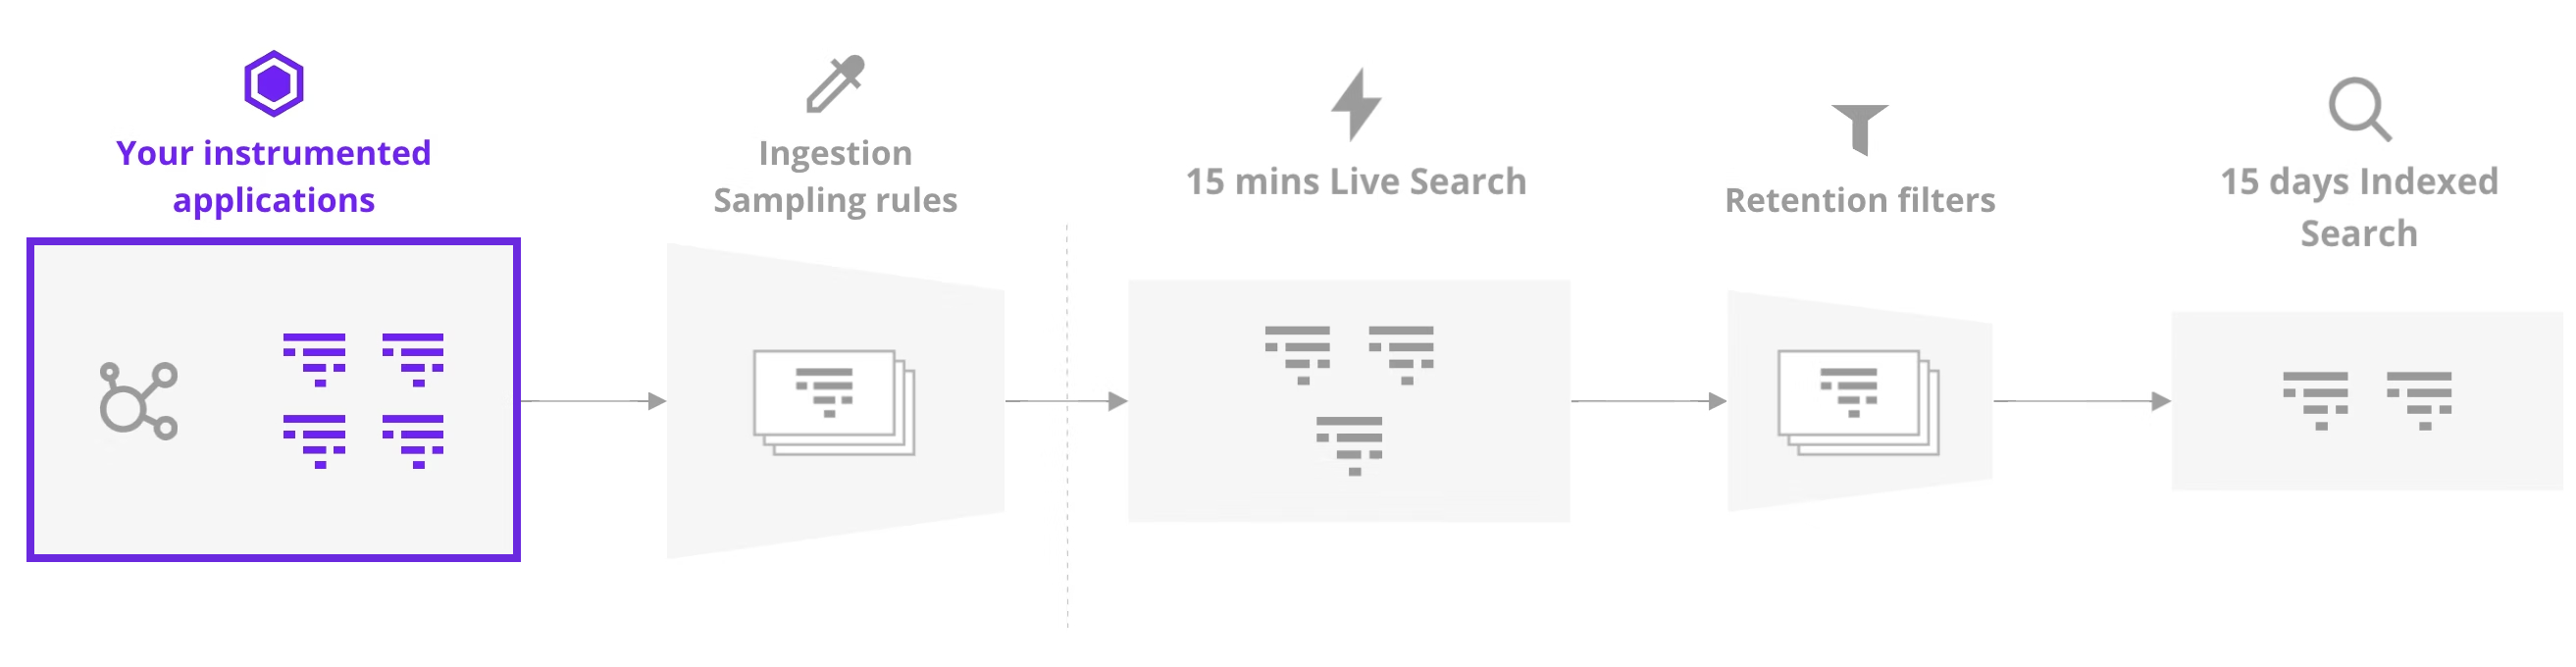
So we’ve got requests hitting our application so we capture 100% of those requests as traces and life is easy right?
If only it were so easy.
By default, your service will save 100 traces per second unless you explicitly set an override.
Datadog does recommend setting a sample rate of 100%, as you’re only charged for traces indexed and retained beyond the initial 15 minute ingestion window.
You may also have cases where code within your application could be explicitly causing traces to be discarded if they’re not useful. The inverse is true with retaining specific traces as well.
The above also assumes that your application is configured properly as well to ensure those traces aren’t being emitted into a black hole.
Agent sampling
Now we go a level high to the process that receives all of your traces.
It has its own sampling which will only retain ~10 traces/second per agent instance. It’s worth noting that this is overridden by setting your application sample rate explicitly but if you haven’t, you’ll be seeing a portion of reality.
You might also get rate limited, causing traces to probably be discarded, if you have too many services connecting to a single agent, your agent is using too much memory or your agent is using too much CPU.

On top of all this, there’s further sampling beyond the “10 traces/second” which is a max of 200 trace events per second. What is a trace event versus a trace you ask? I have no idea!
You should probably also disable the error sampler so it doesn’t impact your picture of reality too for maximum accuracy.
Once again, this too assumes that all of your agent instances are properly configured and aren’t dropping traces off a cliff or else you’ll be missing a portion of reality.
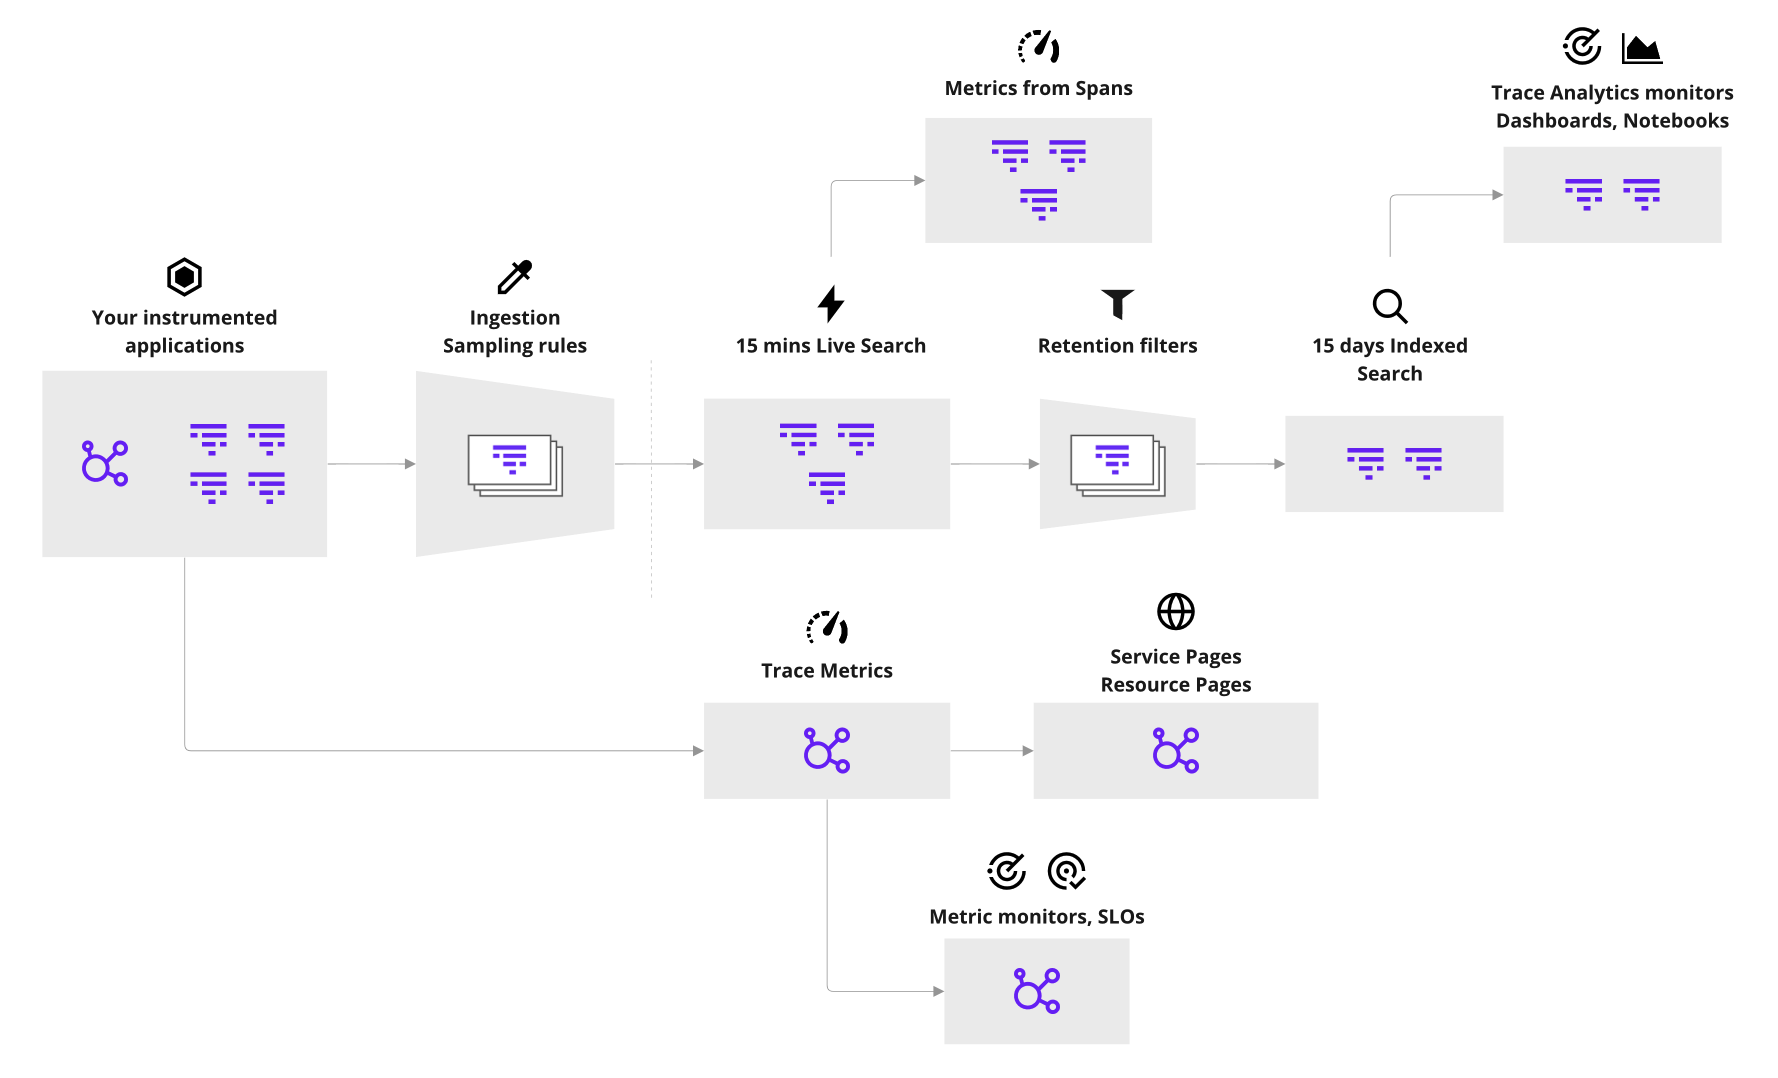
Ingestion Sampling
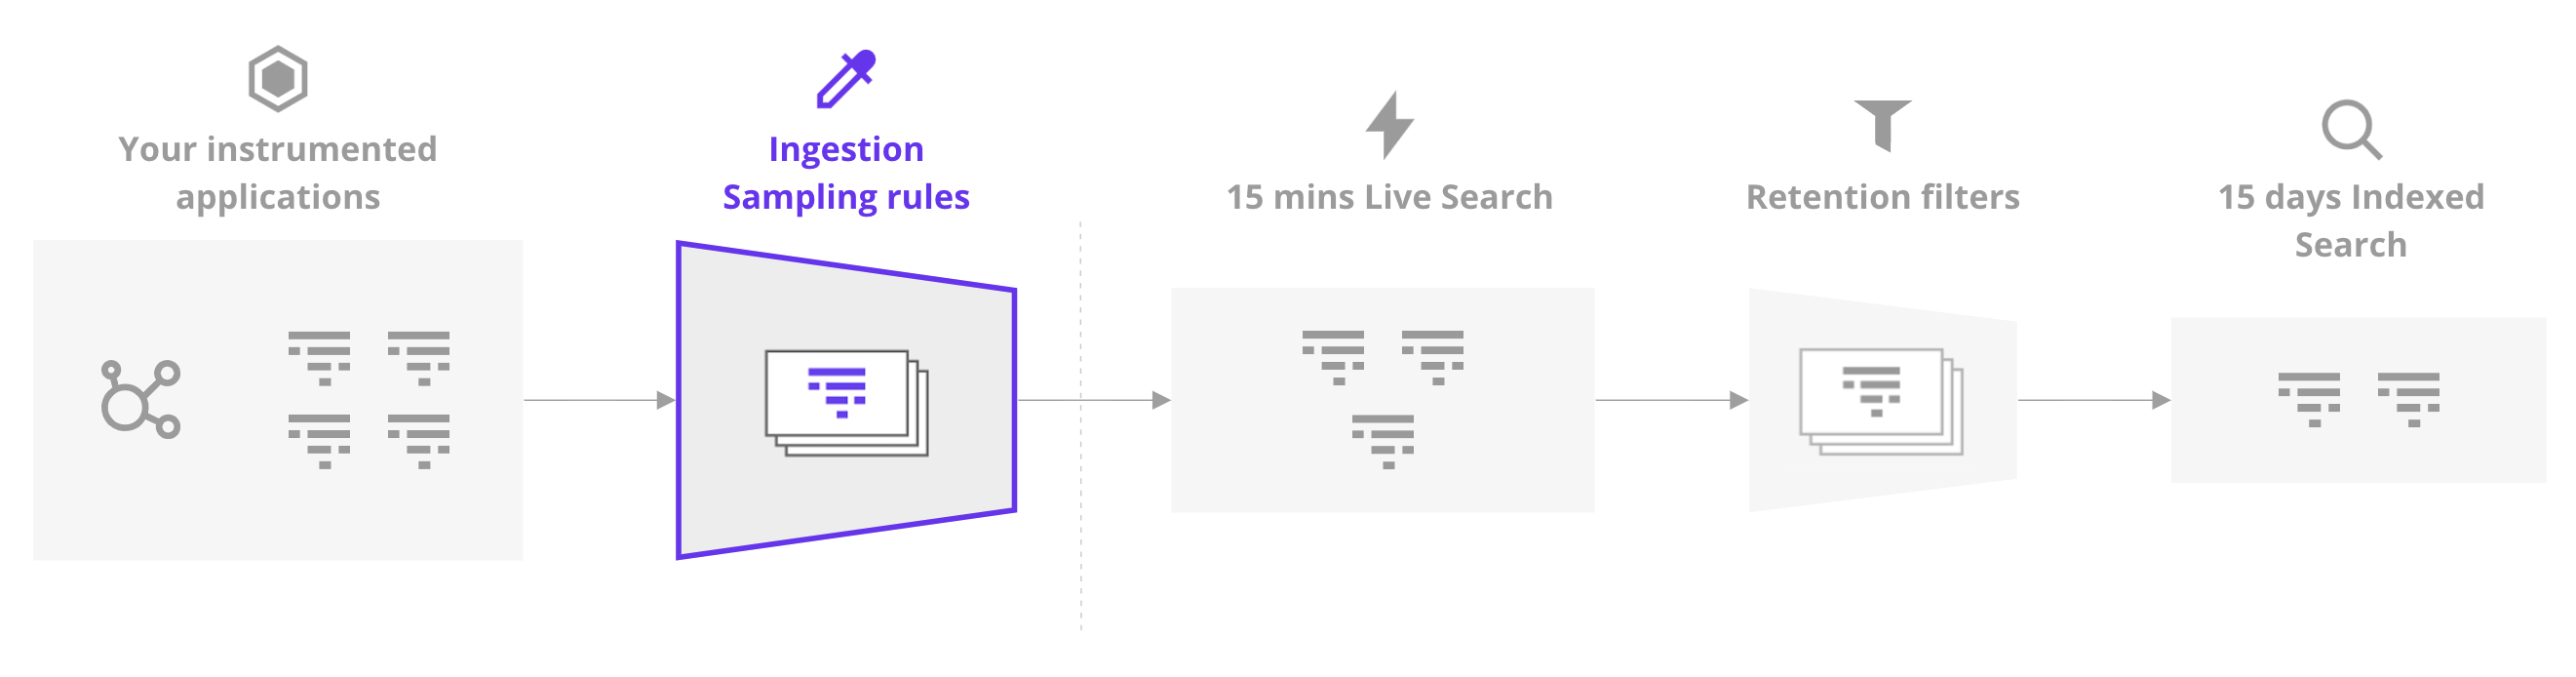
Oh, you thought we were done? We’re just getting started because we’ve got more things to toggle.
So you’ve configured your application and agent perfectly but you’re still not perfectly reflecting reality. Did you know upstream services can decide whether traces involving your service are discarded or retained?.
You should probably go talk to your coworkers who maintain upstream services and argue the case for never sampling a single trace. Depending on who controls the credit card, it may not be quite as compelling when considering the huge bill that may be involved.
Retention Filters
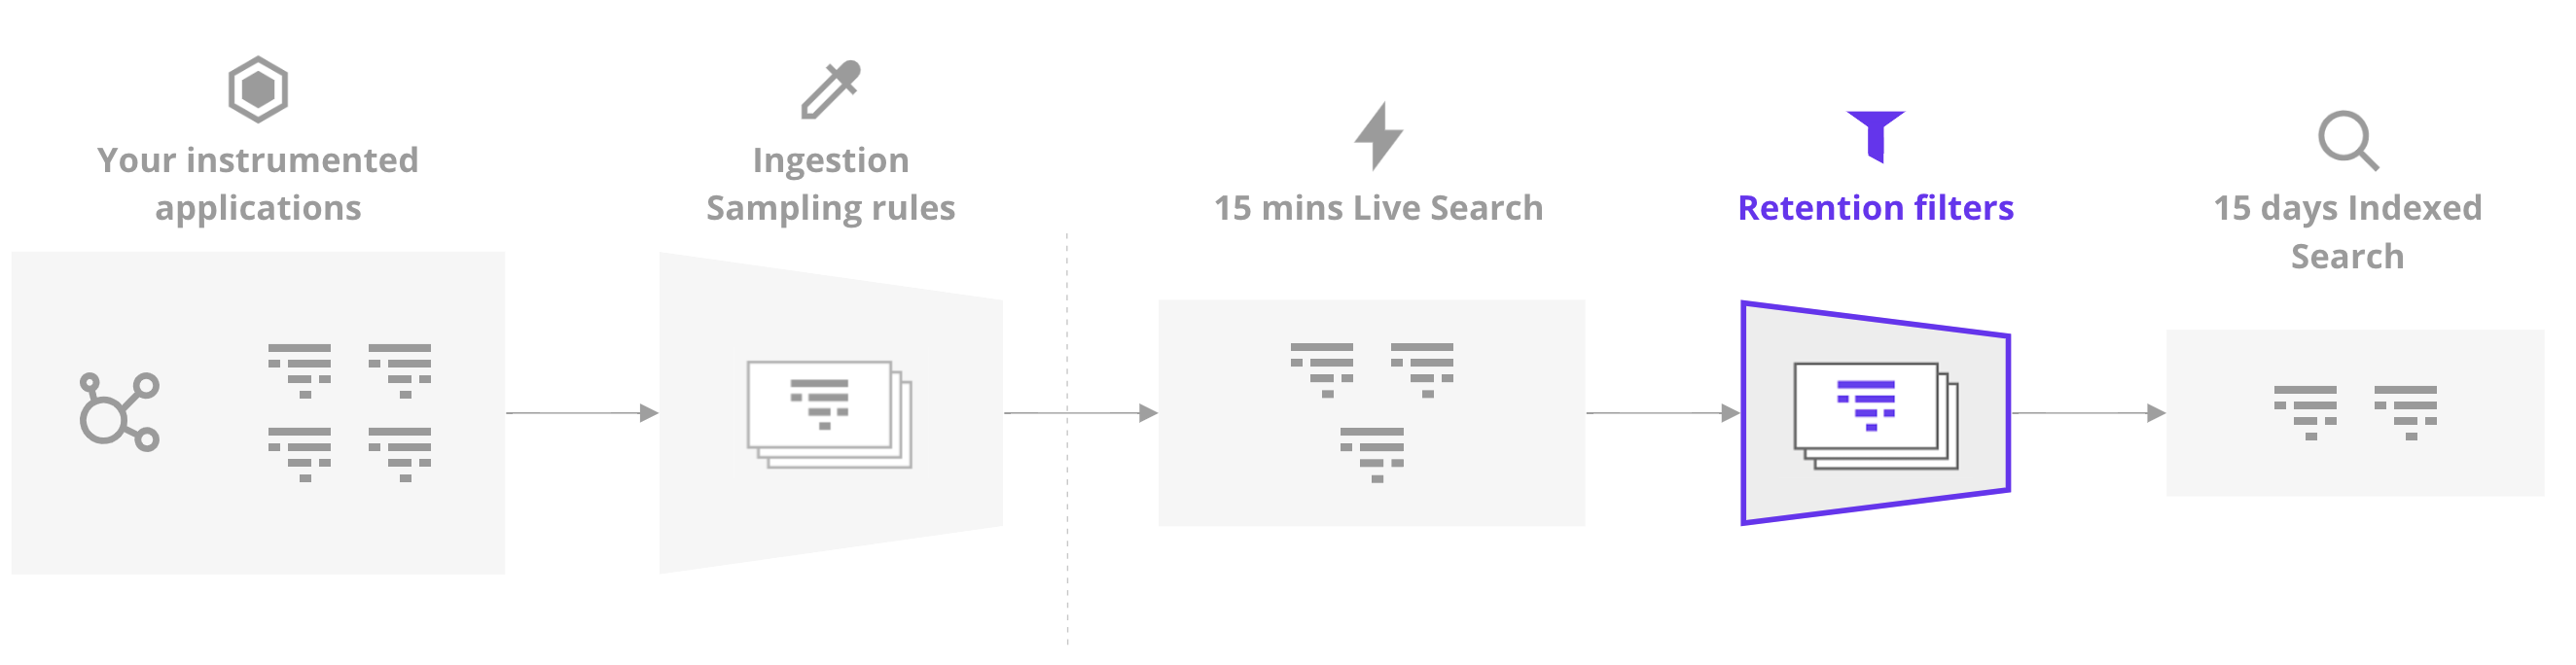
Ok, we’re nearly through the gauntlet because all we’ve got left are retention filters.
So, let’s say that your application sends 100% of traces to Datadog and never gets sampled along the way. That just means your traces are 100% visible for a mere 15 minutes before more sampling kicks in.
Retention filters are the final boss here, where by default, Datadog maintains all errors (across a diverse range of errors codes) and a handful of successful traces based on their latencies, status codes and so on.
Now you could simply mark all traces as being retained beyond that 15 minute window but I hope you’re ready to re-mortgage your house to afford it because indexing ain’t cheap, beyond the defaults chosen by Datadog themselves.
You also need to ensure that no one else has set up any retention filters that might sample your application in any way so fire up those access control policies.
Assuming you’re a rich lister however, you’ve made it to the end… right? All is right with the world and we have a perfectly perfect view of the world.
The Secret Hidden Boss
Even if you have every single trace ever generated, perfection is still out of reach because the insights into our traces themselves may be skewed, short of our combing through all of the data ourselves which is likely not possible at scale.
To understand more, we need to briefly talk about DDSketch which is Datadog’s “sketching” algorithm.
I hadn’t heard of the term before but just as a sketch in drawing is an approximation of a fleshed out drawing, a sketch in computer science is an approximation of some set of data.
The sketch is not a full accurate set of all existing data points but as an approximation, we can infer things that are roughly true about the source data.
For example, let’s say our true data set contains 1 million values and the data set is effectively a random sampling.
We can take a sample of 1000 values from our source data set and in most cases, the median value within our sample is likely to be about the same as it is in our source data set.
While it may not be 100% precise, depending on our use case, it’s probably good enough without the overhead of having to process the full dataset.
Where this doesn’t work however is with quantiles, or percentiles.
Let’s say we wanted to find the maximum value in our 1 million data points. You could just iterate through all of them and keep track of the highest value you’ve seen. There’s no need to keep every data point in memory, just the current value you’re looking at and the highest value you’ve seen so far.
What about finding the 99% percentile? Well, we need to retain all of the values we’ve seen so far in order to continually compare values we’re seeing against our 1% grouping and further comparing that to our full dataset to ensure that we’re adding and removing the right values.
Such a thing would get quite expensive which is where sketching comes in and it’s what Datadog does to your data.
Rather than perfectly calculating percentiles down to the very last decimal place, traces can be “bucketed” into rounded that are near enough to capture what they represent but we only need to store the bucket values and not every single value that is allocated to a bucket.
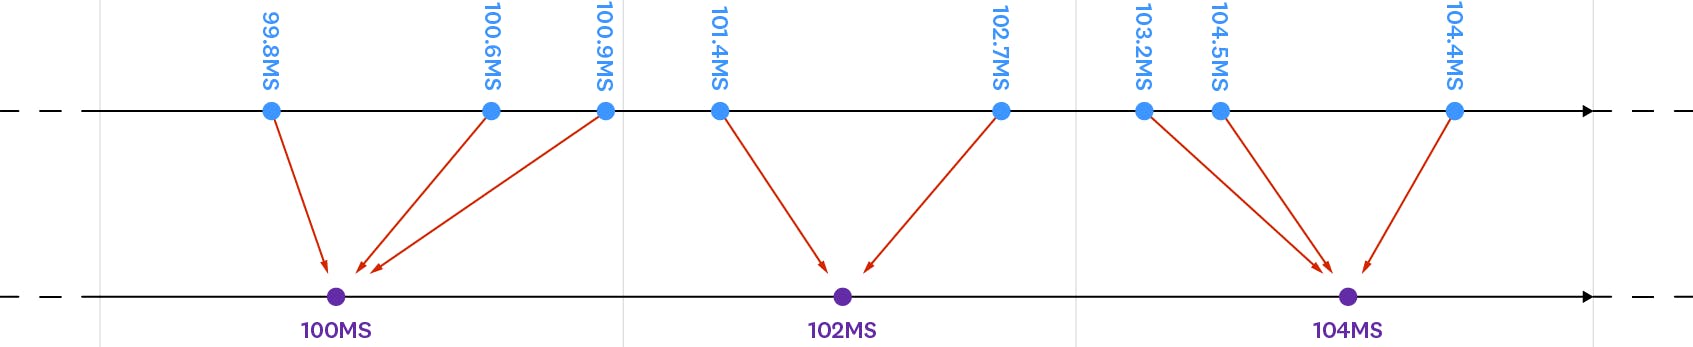
That is effectively the sketch in question and you can read more about the entire process in this blog post.
Suffice to say, even if you did manage to capture all traces, the insights you’re getting from them have likely been skewed from reality ever so slightly through the sketching process so you’ll never win unless you handle each trace yourself.
It doesn’t matter in the end
More than anything, this post is partly a technical guide but mostly fun exercise with the end of goal of saying “Who cares”.
I’m a big fan of the short story On Exactitude in Science. It’s a short story about a kingdom who become so good at map making that they make the most accurate map.
The problem is that it’s 1:1 scale with the kingdom itself in order to capture it in perfect detail. Such a map may be precise but it’s so detailed and unwieldy as to be useless.
I’m a big advocate of the same idea in software.
Partly so I can be lazy but also because beyond a certain point, true accuracy doesn’t really matter.
What you want is just enough detail to know that things are happening but further detail is just diminishing returns.
Let’s say that you want to reflect rate limits for a particular customer.
Does it really matter whether they’re being rate limited 5 times per day or 1000 times per day?
Beyond a certain point, the damage is already done and they’re having a bad time so knowing the true extent doesn’t really change the facts of the situation.
It can be interesting to know for sure and you might want to know but there is probably no such thing as a truly accurate value, whether it’s tracing, logs or something else.
You’re probably better off just getting something good enough and then having a nap or investing that time into other improvements.